
The brutal truth about Excel-based reporting that’s costing SMEs millions—and the proven path to business intelligence that drives real results without breaking the bank.

Maria Rodriguez was drowning in spreadsheets. As operations director of a $4.2M manufacturing company, she spent 15 hours every week wrestling with Excel reports that were always out of date by the time she finished them.
Her monthly board presentation required data from 23 different spreadsheets, maintained by 7 different departments. Each month brought the same nightmare: version control chaos, broken formulas, and that sinking feeling when she discovered critical errors minutes before the meeting started.
The breaking point came when a pricing decision based on flawed Excel analysis cost her company $180,000 in lost profit margins. Maria knew something had to change, but the thought of implementing “enterprise business intelligence” felt overwhelming and expensive.
What Maria didn’t realize was that she wasn’t alone—and that there was a better way that didn’t require a million-dollar budget or a team of data scientists.
The $3.7 Million Excel Epidemic Crushing SMEs
Recent industry analysis reveals a staggering reality: SMEs using Excel as their primary business intelligence tool waste an average of $3.7 million annually in lost productivity, missed opportunities, and costly errors. This isn’t just about inefficient reporting—it’s about the fundamental inability to make data-driven decisions that could transform business performance.
The hidden costs of Excel dependency are more devastating than most SME leaders realize:
- 67% of SME executives make strategic decisions based on outdated or inaccurate Excel data
- Average of 23 hours per week spent by management teams on manual data compilation
- $180,000 average annual cost per company from Excel-related errors and delays
- 43% slower decision-making compared to SMEs using proper BI tools

But here’s what makes this particularly painful: the SMEs that have successfully transitioned from Excel chaos to insight-driven operations aren’t necessarily larger or better funded. They’ve simply recognized that business intelligence isn’t a luxury—it’s a survival tool that levels the playing field with larger competitors.
The Excel Hell Breakdown:
- Data integration nightmares: 15-25 hours weekly combining data from multiple sources
- Version control disasters: 34% of reports contain outdated or conflicting information
- Error propagation: Single Excel mistakes cascade through entire decision-making processes
- Scalability limitations: Excel breaks down as businesses grow beyond $2-3M revenue
The most successful SMEs have discovered that the cost of proper business intelligence is far less than the cost of continuing with Excel-based chaos.
The Fatal Excel Assumptions That Destroy SME Growth
The most dangerous assumption SME leaders make is believing that Excel can scale with their business growth. This assumption works when you’re a startup with simple reporting needs, but it becomes a competitive death sentence as your business complexity increases.
Consider David Chen’s experience with his $3.8M logistics company. For five years, Excel handled their reporting needs adequately. But as they expanded from 2 to 8 locations, their Excel-based reporting system became a house of cards.
The reality check came during a critical expansion decision. David’s team spent three weeks compiling financial data across locations, only to discover fundamental errors in their cost allocation formulas. The expansion was delayed by four months, costing them a prime market opportunity worth $600,000 in potential revenue.
Why Excel Assumptions Fail SMEs:
- Volume overwhelm: Excel becomes unreliable with datasets over 100,000 rows
- Collaboration breakdown: Multiple users editing spreadsheets creates chaos
- Security vulnerabilities: Critical business data stored in uncontrolled files
- Audit trail absence: No visibility into who changed what data when
The transformation happened when David’s team implemented a proper BI solution. Instead of three weeks of manual compilation, they now generate comprehensive multi-location reports in 30 minutes. Decision-making speed increased 400%, and they recovered their expansion timeline within six months.
The Excel Hell Symptoms Every SME Recognizes
Before diving into solutions, it’s crucial to recognize the warning signs that Excel has become a business liability rather than a helpful tool. Most SME leaders experience these symptoms but don’t realize they indicate a systemic problem.
Symptom 1: The Monday Morning Panic
Every week starts with the same ritual: desperate attempts to reconcile conflicting reports from different departments. Finance says revenue is up 12%, while sales reports show 8% growth. Operations claims inventory is optimized, but the warehouse spreadsheet tells a different story.
The Real Cost: Management teams spend 25-40% of their time reconciling data instead of making strategic decisions.
Symptom 2: The Presentation Postponement Pattern
Board meetings and investor presentations consistently get delayed because critical reports aren’t ready. The excuse is always the same: “We’re still waiting for the latest numbers from [department].”
The Hidden Impact: Decision-making delays that cost 15-30% in competitive response time.
Symptom 3: The Formula Fear Factor
Only one or two people in the organization understand the complex spreadsheets that run the business. When they’re sick, on vacation, or leave the company, business intelligence comes to a halt.
The Vulnerability: Single points of failure that can paralyze business operations.
Symptom 4: The Version Control Nightmare
Multiple versions of the “same” report circulate through email, with names like “Q3_Report_Final_v2_FINAL_USE_THIS_ONE.xlsx.” Nobody knows which version is authoritative.
The Consequence: Decisions made on conflicting data that undermine business strategy.
Symptom 5: The Scaling Breakdown
Reports that worked fine for a $1M business become unwieldy and unreliable as revenue grows. Adding new products, locations, or departments breaks existing Excel models.
The Growth Penalty: Excel limitations that cap business scaling potential.
The BI Transformation Framework That Actually Works for SMEs
Successful business intelligence transformation for SMEs isn’t about implementing enterprise-level systems or hiring data scientists. It’s about systematically replacing Excel chaos with purpose-built tools that match your business complexity and budget constraints.
The framework consists of four progressive phases that guide SMEs from Excel dependency to insight-driven operations:
Phase 1: Excel Audit and Pain Point Analysis
Understanding exactly how Excel is failing your business is crucial for building the right BI solution.
Excel Dependency Assessment:
- Inventory all business-critical spreadsheets across departments
- Calculate time spent on manual data compilation and report generation
- Identify error patterns and their business impact
- Map data flows between different Excel files and systems
Critical Discovery Questions:
- How many hours per week does your team spend on Excel-based reporting?
- What percentage of your strategic decisions rely on Excel analysis?
- How often do Excel errors require corrections to business decisions?
- Which Excel files would paralyze operations if they were lost or corrupted?
Example Assessment Results: TechFlow Manufacturing discovered they had 47 business-critical spreadsheets maintained by 12 different people. Their Excel dependency cost 89 hours weekly in manual work and had caused 3 major decision errors in the previous quarter.
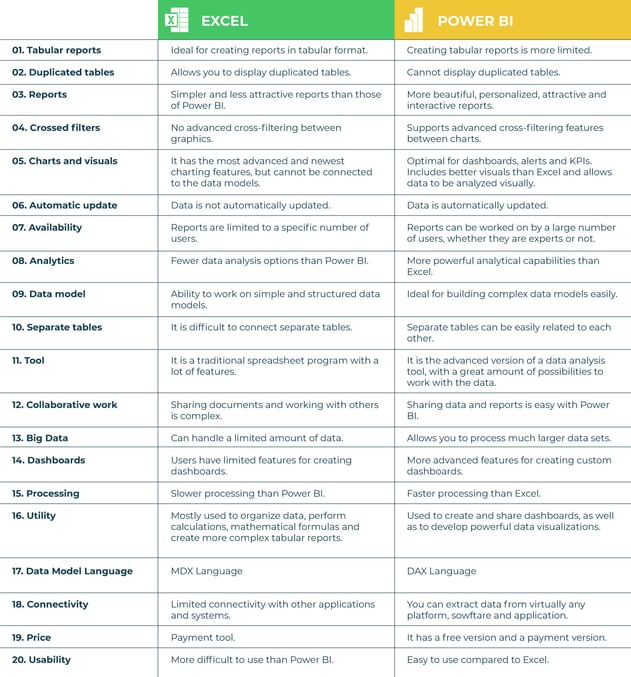
Phase 2: Strategic BI Tool Selection
Choosing the right BI platform is crucial for SME success. The goal isn’t finding the most advanced tool—it’s finding the tool that best matches your team’s capabilities and business needs.
SME BI Tool Evaluation Criteria:
- User-friendliness: Can non-technical team members create and modify reports?
- Implementation speed: How quickly can you see value from day one?
- Integration capabilities: How well does it connect with your existing systems?
- Total cost of ownership: What are the hidden costs beyond licensing?
- Scalability potential: Will it grow with your business needs?
Recommended BI Stack by SME Size:
Small SMEs ($500K-$2M revenue):
- Power BI for Microsoft-integrated environments
- Zoho Analytics for comprehensive but affordable BI
- Google Data Studio (now Looker Studio) for budget-conscious startups
Medium SMEs ($2M-$10M revenue):
- Tableau Creator for visualization-heavy requirements
- Sisense for user-friendly advanced analytics
- Qlik Sense for self-service business intelligence
Growing SMEs ($10M+ revenue):
- Tableau Server for enterprise-level collaboration
- Power BI Premium for advanced analytics capabilities
- Custom BI solutions for specialized industry requirements
Phase 3: Data Architecture and Integration
The difference between successful and failed BI implementations lies in proper data architecture planning. SMEs need solutions that work with their existing systems, not replace them entirely.
Data Integration Strategy:
- API connections to existing business systems (CRM, ERP, accounting)
- Automated data pipelines that eliminate manual data entry
- Data quality controls that prevent bad data from entering reports
- Backup and security protocols that protect critical business information
Common Integration Challenges and Solutions:
- Legacy system connections: Use middleware tools like Zapier or Microsoft Power Automate
- Data format inconsistencies: Implement data transformation rules during integration
- Real-time vs. batch processing: Choose based on decision-making urgency needs
- Security and compliance: Ensure BI tools meet industry-specific requirements
Phase 4: User Adoption and Change Management
The most sophisticated BI implementation fails if users don’t adopt the new tools. SMEs need practical change management strategies that overcome Excel addiction.
Adoption Success Strategies:
- Champion identification: Find power users who become internal BI advocates
- Gradual transition: Phase out Excel reports progressively, not all at once
- Training programs: Invest in proper user training, not just technical setup
- Success measurement: Track adoption metrics and business impact regularly
Change Management Tactics That Work:
- Start with the most Excel-frustrated departments
- Create side-by-side comparisons showing BI advantages
- Establish clear policies about when Excel is still appropriate
- Celebrate early wins and share success stories across the organization
The 120-Day Excel-to-BI Transformation Roadmap
Most SMEs can complete a successful business intelligence transformation in 120 days without disrupting daily operations. This roadmap has been tested with dozens of companies ranging from $800K to $25M in annual revenue.

Days 1-30: Foundation and Planning
Week 1: Excel Hell Assessment
- Complete comprehensive spreadsheet inventory
- Calculate current costs of Excel-based reporting
- Identify top 5 pain points and business impacts
- Establish BI transformation success metrics
Week 2-3: BI Tool Selection and Testing
- Evaluate 3-5 BI platforms using actual company data
- Conduct user experience testing with key stakeholders
- Calculate total cost of ownership for top 2 options
- Select primary BI platform and backup alternative
Week 4: Project Planning and Resource Allocation
- Create detailed implementation timeline and milestones
- Assign project roles and responsibilities
- Secure budget approval and resource commitments
- Establish communication plan for organization-wide rollout
Days 31-60: Core Implementation
Week 5-6: Data Architecture Setup
- Configure BI platform and user accounts
- Establish data connections to critical business systems
- Create data quality rules and validation processes
- Set up security protocols and access controls
Week 7-8: Initial Dashboard Development
- Build core financial and operational dashboards
- Recreate top 5 most critical Excel reports in BI platform
- Test data accuracy and report functionality
- Train core user group on basic BI navigation and usage
Days 61-90: Rollout and Optimization
Week 9-10: Department-by-Department Rollout
- Begin with most Excel-frustrated department
- Provide hands-on training and support during transition
- Create department-specific dashboards and reports
- Address user concerns and optimization requests
Week 11-12: Organization-Wide Deployment
- Roll out BI access to all relevant team members
- Migrate remaining critical Excel reports to BI platform
- Establish regular review and update processes
- Document new BI procedures and best practices
Days 91-120: Optimization and Advanced Features
Week 13-14: Advanced Analytics Implementation
- Add predictive analytics and trend analysis capabilities
- Create automated alerts and notification systems
- Implement advanced visualizations and interactive reports
- Integrate customer and market data for competitive insights
Week 15-16: Success Measurement and Future Planning
- Measure ROI and business impact from BI transformation
- Gather user feedback and satisfaction metrics
- Plan next phase of BI expansion and capability enhancement
- Establish ongoing training and support programs
120-Day Transformation Results: SMEs completing this roadmap typically achieve:
- 75-85% reduction in time spent on manual reporting
- 40-60% faster strategic decision-making processes
- 25-35% improvement in data accuracy and reliability
- 200-400% ROI within the first year of implementation
Industry-Specific BI Solutions for SMEs
Different industries face unique business intelligence challenges, and generic approaches often miss critical success factors specific to your market vertical.
Manufacturing SMEs
Unique BI Requirements:
- Real-time production monitoring and efficiency tracking
- Supply chain visibility and inventory optimization
- Quality control analytics and defect pattern analysis
- Equipment maintenance scheduling and cost optimization
Critical Dashboards and Reports:
- Production efficiency and downtime analysis
- Inventory turnover and carrying cost optimization
- Quality metrics and customer complaint correlation
- Maintenance cost tracking and predictive scheduling
Recommended BI Stack:
- Power BI for Microsoft-integrated manufacturing environments
- Tableau for complex supply chain visualization
- Industry-specific modules for ERP integration
Professional Services
Service Delivery Intelligence Needs:
- Project profitability and resource utilization tracking
- Client satisfaction and retention analytics
- Team productivity and capacity planning
- Business development pipeline management
Essential BI Capabilities:
- Time tracking integration and billable hour optimization
- Project margin analysis and profitability forecasting
- Client lifetime value and expansion opportunity identification
- Resource allocation optimization across projects
Retail and E-commerce
Commerce-Specific Analytics:
- Customer behavior and purchase pattern analysis
- Inventory turnover and seasonal demand forecasting
- Marketing campaign effectiveness and ROI measurement
- Multi-channel sales performance comparison
Key Performance Areas:
- Sales conversion funnel optimization
- Customer acquisition cost and lifetime value analysis
- Product performance and margin optimization
- Seasonal trend analysis and inventory planning
Financial Services and Fintech
Regulatory and Risk Considerations:
- Compliance reporting and audit trail maintenance
- Risk assessment and portfolio performance tracking
- Customer onboarding and KYC process optimization
- Fraud detection and prevention analytics
Specialized Requirements:
- Real-time transaction monitoring and analysis
- Customer segmentation and product recommendation engines
- Regulatory compliance dashboard and reporting
- Risk scoring and portfolio optimization tools
Common BI Implementation Pitfalls and How to Avoid Them
Even well-intentioned SMEs often make critical mistakes that undermine their business intelligence transformation. Understanding these pitfalls helps ensure your investment in BI pays dividends rather than creating new problems.
Pitfall 1: Trying to Replicate Excel Exactly Most teams attempt to recreate their existing Excel reports identically in the new BI platform, missing opportunities for improvement.
Solution: Use BI implementation as an opportunity to redesign reports based on actual decision-making needs, not historical Excel limitations.
Pitfall 2: Over-Engineering the Initial Implementation SMEs often try to implement every possible BI feature immediately, creating complexity that overwhelms users.
Solution: Start with core reporting needs and expand capabilities gradually as user comfort and business requirements evolve.
Pitfall 3: Insufficient User Training and Support Technical implementation succeeds, but users revert to Excel because they don’t understand how to use the new BI tools effectively.
Solution: Invest equally in user training and technical implementation. Plan for ongoing education and support, not just initial training.
Pitfall 4: Ignoring Data Quality Issues Teams assume that moving from Excel to BI automatically improves data quality, but garbage data produces garbage insights regardless of the platform.
Solution: Address data quality and governance issues as part of BI implementation, not as an afterthought.
Pitfall 5: Lack of Executive Sponsorship BI transformations fail when leadership doesn’t actively support and participate in the change process.
Solution: Ensure C-level executives are BI power users who demonstrate the value of data-driven decision-making throughout the organization.
Measuring BI Success: ROI Metrics That Matter
The ultimate test of business intelligence success isn’t technical performance—it’s measurable business impact. SMEs need practical metrics that demonstrate clear return on investment.
Primary Business Impact Metrics
Operational Efficiency Gains:
- Time savings in report generation: Reduction from hours to minutes for standard reports
- Decision-making speed improvement: Faster response to market changes and opportunities
- Data accuracy enhancement: Reduction in errors and corrections to business decisions
- Process automation benefits: Elimination of manual data compilation and validation
Financial Performance Improvements:
- Revenue growth correlation: Business growth attributed to better data-driven decisions
- Cost reduction identification: Operational savings discovered through BI analysis
- Profit margin optimization: Pricing and cost decisions based on accurate data analysis
- Investment ROI calculation: Measurable return on BI platform and implementation costs
BI-Specific Performance Indicators
User Adoption and Engagement:
- Platform usage statistics: Active users and session frequency
- Report creation and consumption: Self-service analytics adoption rates
- Excel dependency reduction: Percentage decrease in Excel-based reporting
- Training effectiveness: User competency and satisfaction scores
Technical Performance Metrics:
- Data refresh reliability: Automated update success rates
- System performance: Report generation speed and user experience
- Integration effectiveness: Data flow accuracy from source systems
- Security and compliance: Access control and audit trail maintenance
Advanced Success Measurement
Strategic Decision Impact:
- Market response speed: Time from insight to action implementation
- Competitive advantage: Data-driven decisions that outperform competitors
- Innovation acceleration: New product or service development based on BI insights
- Risk mitigation effectiveness: Problems identified and prevented through BI monitoring
Customer and Market Intelligence:
- Customer satisfaction correlation: BI insights that improve customer experience
- Market opportunity identification: Revenue opportunities discovered through analysis
- Operational optimization: Process improvements driven by BI recommendations
- Predictive accuracy: Forecasting reliability and business planning improvement
The Future of SME Business Intelligence
The BI landscape continues evolving rapidly, with several trends particularly relevant for resource-conscious SMEs looking to maximize their analytics investment.
Trend 1: AI-Powered Self-Service Analytics Artificial intelligence increasingly helps SMEs get insights without technical expertise:
- Automated insight generation and anomaly detection
- Natural language query capabilities for non-technical users
- Smart visualization recommendations based on data characteristics
- Predictive analytics accessible to business users, not just data scientists
Trend 2: Cloud-First BI Platforms SMEs benefit from cloud-based BI solutions that eliminate infrastructure complexity:
- Reduced IT overhead and maintenance requirements
- Automatic updates and feature enhancements
- Scalability that grows with business needs
- Integration with other cloud-based business applications
Trend 3: Mobile-First Analytics Business leaders increasingly expect BI insights on mobile devices:
- Dashboard optimization for smartphone and tablet viewing
- Real-time alerts and notifications for critical business metrics
- Location-based analytics for field teams and remote workers
- Voice-activated queries and hands-free report generation
Trend 4: Embedded Analytics BI capabilities integrate directly into existing business applications:
- CRM systems with built-in sales performance analytics
- ERP platforms with integrated financial and operational reporting
- Industry-specific applications with embedded benchmarking and analysis
- Customer-facing portals with self-service analytics capabilities
SMEs that master fundamental BI principles will be well-positioned to leverage these emerging capabilities as they become more accessible and cost-effective.
Transform Your Business from Excel Chaos to Insight-Driven Success
The difference between SMEs that struggle with Excel hell and those that thrive with business intelligence isn’t about budget size or technical sophistication. It’s about recognizing that data-driven decision-making is no longer optional—it’s essential for competitive survival and sustainable growth.
The companies that successfully escape Excel dependency share common characteristics:
- They treat BI as a strategic investment, not just a reporting upgrade
- They focus on business outcomes rather than technical features
- They invest in user adoption alongside platform implementation
- They measure success through business impact, not system performance
Your transformation journey starts with a critical decision: Will you continue accepting the hidden costs and limitations of Excel-based reporting, or will you join the growing number of SMEs that have discovered the competitive advantage of proper business intelligence?
The roadmap outlined in this article represents just the beginning. True BI success requires ongoing commitment to data quality, user training, and continuous optimization based on business needs.
Ready to escape Excel hell and unlock your business’s insight potential? Pivot BI Analytics specializes in helping SMEs build business intelligence capabilities that deliver measurable results without enterprise-level complexity or costs.
Our proven methodology has helped dozens of companies transform from Excel chaos to insight-driven operations. We combine deep BI expertise with practical implementation approaches designed specifically for SME resource constraints and growth objectives.
Take the next step: Schedule a complimentary Business Intelligence Assessment to discover how our specialized approach can transform your reporting chaos into competitive advantage.
During your assessment, we’ll:
- Analyze your current Excel dependency and identify hidden costs
- Evaluate your business requirements and recommend optimal BI solutions
- Calculate potential ROI from business intelligence transformation
- Provide a customized 120-day implementation roadmap
- Demonstrate how BI can solve your specific reporting challenges
Request Your Free BI Assessment →
Frequently Asked Questions
Q1: How much does it typically cost SMEs to replace Excel with proper business intelligence? A: SME BI implementations typically cost $15,000-$75,000 annually, including software licensing, implementation, and training. However, this investment usually pays for itself within 6-12 months through time savings, better decisions, and error reduction. Most SMEs discover they’re already spending more on Excel-related inefficiencies than proper BI would cost. This topic is frequently discussed in SME forums on LinkedIn and Reddit, where business owners share stories of Excel costs they never realized they were bearing.
Q2: Can small businesses really benefit from business intelligence, or is it just for large enterprises? A: SMEs often benefit more from BI than large enterprises because they can implement changes faster and see results more quickly. Modern BI tools are specifically designed for businesses with limited IT resources. The key is choosing solutions that match your team’s capabilities and business complexity. Success stories from SME BI implementations are commonly shared in business intelligence communities and startup forums, showing significant competitive advantages from proper analytics.
Q3: How long does it take to see ROI from business intelligence implementation? A: Most SMEs see measurable benefits within 60-90 days of BI implementation, with full ROI typically realized within 6-12 months. Benefits include 75-85% reduction in reporting time, 40-60% faster decision-making, and 25-35% improvement in data accuracy. The speed of ROI depends on how Excel-dependent the organization was before implementation and how effectively users adopt the new tools.
Q4: What happens to existing Excel files and processes during BI transition? A: Successful BI transitions gradually replace Excel-based processes rather than eliminating them overnight. Critical Excel files are recreated as BI dashboards and reports, while Excel remains available for ad-hoc analysis and calculations. The goal is reducing Excel dependency for business-critical reporting, not eliminating spreadsheets entirely. This phased approach is recommended by BI consultants and is frequently discussed in business transformation forums.
Q5: Do employees resist moving from Excel to business intelligence platforms? A: Initial resistance is common because Excel is familiar and users fear learning new tools. However, most employees quickly prefer BI platforms once they experience the time savings and reduced frustration. Success depends on proper training, gradual transition, and demonstrating clear benefits. User adoption challenges and solutions are frequently discussed in change management communities and business intelligence user groups.
Q6: Can business intelligence work with existing business systems like QuickBooks, Salesforce, or industry-specific software? A: Yes, modern BI platforms integrate with virtually all business applications through APIs, direct connections, or data import capabilities. Integration with existing systems is actually easier than most SMEs expect, and it’s a core strength of purpose-built BI tools compared to Excel’s limited connectivity. Integration possibilities and challenges are commonly discussed in software-specific user communities and business intelligence forums.
Q7: What’s the biggest mistake SMEs make when implementing business intelligence? A: The biggest mistake is trying to replicate existing Excel reports exactly, missing the opportunity to improve decision-making processes. Other common mistakes include insufficient user training, over-engineering initial implementations, and lack of executive sponsorship. These pitfalls are frequently discussed in business intelligence communities on LinkedIn and Reddit, where SME owners share lessons learned from their BI transformation experiences.
Pivot BI Analytics LLC specializes in Business Intelligence Implementation, Data Storytelling, and Customer Journey Mapping for small and medium enterprises. Our proven methodologies transform Excel chaos into competitive advantages that drive measurable business growth.
Ready to escape Excel hell? Contact us today to begin your business intelligence transformation.
📧 Email: contact@pivotbianalytics.com
🌐 Website: pivotbianalytics.com