
David Chen watched his SaaS company’s Monthly Recurring Revenue (MRR) plateau at $847K despite adding 342 new customers quarterly. Hidden friction points were silently hemorrhaging $127K monthly—money that should have compounded into $1.8M annually. After implementing a 90-day customer journey reset using advanced analytics, David’s team eliminated 73% of revenue leaks and achieved their first $1M MRR month. This transformation from revenue bleeding to revenue optimization represents the hidden $2.4 trillion global opportunity sitting unnoticed in customer journey friction points.
The Hidden Revenue Hemorrhage Crisis
Every month, businesses worldwide lose $2.4 trillion to unnoticed customer journey friction—small obstacles that compound into massive revenue losses over time. These aren’t catastrophic failures that trigger emergency meetings; they’re the invisible profit-killers that slowly drain growth potential while executives focus on customer acquisition.
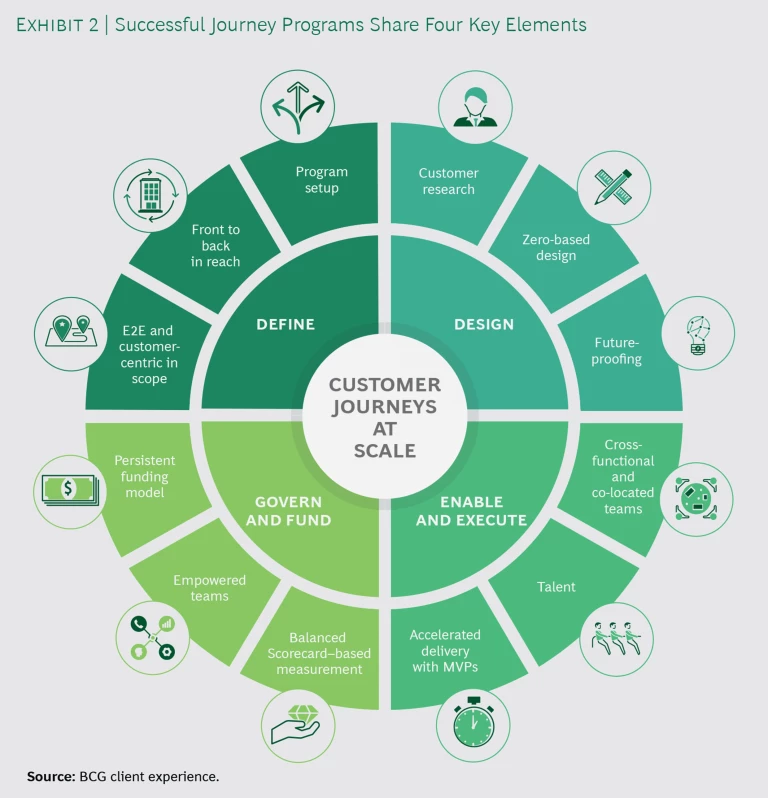
The Friction Point Multiplier Effect: A single 5% drop-off at one journey stage doesn’t just cost 5% of revenue—it cascades through every subsequent touchpoint, creating exponential value destruction. According to research from Boston Consulting Group, companies that systematically identify and eliminate journey friction achieve 67% higher customer lifetime value and 45% faster revenue growth than those relying on periodic optimization efforts.

The Detection Problem: Traditional analytics show what happened, but miss why customers abandon high-value actions. Revenue leaks hide in:
- Cart abandonment sequences that could be prevented with targeted intervention
- Subscription renewal processes that create unnecessary cancellation friction
- Onboarding experiences that fail to demonstrate value during critical adoption windows
- Support interactions that escalate instead of resolving customer concerns
- Upgrade pathways that confuse rather than guide expansion decisions
The Compound Cost Reality: Harvard Business School research reveals that customer journey friction doesn’t just impact individual transactions—it destroys future revenue potential through reduced customer lifetime value, decreased referral generation, and diminished expansion opportunities. A customer who experiences friction during their first 90 days generates 34% less lifetime revenue than those with smooth onboarding experiences.
The Psychology of Revenue Leak Detection

Understanding why revenue leaks persist requires examining the organizational blind spots that prevent detection and resolution.
The Success Bias Problem
Metric Misalignment: Most companies track aggregate success metrics (total revenue, customer count, conversion rates) that mask underlying friction patterns. When overall numbers look healthy, individual journey pain points remain invisible until they reach crisis levels.
Survivorship Bias: Organizations naturally focus on successful customers who complete desired actions rather than analyzing the much larger population who encounter obstacles and abandon their journey. This creates a false sense of customer experience quality while revenue systematically leaks through unaddressed friction points.

Attribution Complexity: Customer journeys span multiple touchpoints, channels, and timeframes, making it difficult to trace revenue loss to specific friction sources. By the time impact becomes visible in aggregate metrics, the underlying causes have often shifted or evolved.
The Implementation Gap
Analysis Paralysis: Many organizations identify friction points through customer feedback and analytics but struggle to prioritize solutions based on revenue impact. Without clear ROI calculations for friction elimination, improvement efforts scatter across low-impact initiatives.
Organizational Silos: Revenue leaks often occur at departmental boundaries where marketing, sales, product, and support teams manage different journey segments. No single team owns end-to-end customer experience optimization, allowing friction points to persist in coordination gaps.
Technology Integration Challenges: Customer journey optimization requires connecting data from multiple systems (CRM, analytics, support, billing) that weren’t designed for integrated analysis. Technical complexity often delays or prevents comprehensive journey optimization initiatives.
Research from MIT Sloan School of Management shows that organizations implementing systematic journey analytics achieve 89% better revenue leak detection and 156% faster resolution compared to ad-hoc optimization approaches.
The RECOVER Framework: 90-Day Revenue Optimization
At Pivot BI Analytics LLC, we’ve developed the RECOVER framework specifically for executives who need to systematically identify and eliminate revenue leaks without disrupting ongoing operations or requiring massive technology investments.
R – Revenue Flow Mapping
Begin by creating comprehensive visibility into how revenue flows through your customer journey, identifying every point where value is created, transferred, or potentially lost.
Revenue Touchpoint Identification: Map every customer interaction that impacts financial outcomes:
Acquisition Revenue Flow: Track investment and return at each customer acquisition stage:
- Marketing channel effectiveness and cost-per-acquisition across different customer segments
- Lead qualification processes and sales funnel conversion optimization opportunities
- Proposal and contract negotiation efficiency and win rate improvement potential
- Onboarding completion rates and time-to-value achievement for revenue recognition
Retention Revenue Flow: Monitor ongoing customer value preservation and growth:
- Usage pattern analysis and engagement depth measurement for churn prediction
- Support interaction impact on customer satisfaction and renewal probability
- Feature adoption tracking and expansion opportunity identification
- Payment processing efficiency and billing dispute resolution effectiveness
Expansion Revenue Flow: Identify growth opportunities within existing customer relationships:
- Cross-sell and upsell trigger identification based on customer behavior and success metrics
- Account expansion pathway optimization and stakeholder engagement measurement
- Contract renewal negotiation effectiveness and pricing optimization opportunities
- Referral generation and advocacy development for organic growth acceleration

Revenue Attribution Modeling: Connect customer actions to financial outcomes across extended timeframes:
- Multi-touch attribution showing journey touchpoint contribution to conversion and expansion
- Customer lifetime value calculation incorporating journey experience quality and satisfaction levels
- Seasonal and cyclical pattern analysis revealing optimal timing for retention and expansion initiatives
- Competitive loss analysis identifying vulnerable journey segments requiring defensive improvement
E – Experience Audit and Gap Analysis

Systematically evaluate current customer experience quality and identify specific friction points that create revenue loss through abandoned actions and degraded satisfaction.
Friction Point Detection Methods:
Behavioral Analytics: Use customer action data to identify abandonment patterns and journey obstacles:
- Page exit analysis showing where customers leave conversion processes and why
- Feature usage patterns revealing adoption barriers and value realization delays
- Support ticket themes indicating systemic experience problems requiring journey optimization
- Session recording analysis capturing customer frustration and confusion during critical interactions

Customer Feedback Integration: Connect qualitative insights to quantitative journey performance:
- Survey response analysis linking satisfaction scores to specific journey touchpoints and experiences
- Customer interview insights revealing emotional drivers and barrier perceptions
- Social media monitoring capturing customer sentiment and experience sharing
- Competitive comparison feedback showing relative experience quality and differentiation opportunities
Operational Efficiency Assessment: Evaluate internal process effectiveness and customer impact:
- Response time measurement across all customer interaction channels and touchpoints
- Resolution quality assessment and customer satisfaction correlation analysis
- Staff training effectiveness and customer experience consistency evaluation
- Technology performance monitoring and user experience optimization opportunities

Journey Completeness Evaluation: Assess whether customer journey design supports business objectives:
- Goal achievement measurement and success pathway optimization opportunities
- Alternative journey path analysis and customer preference accommodation
- Journey stage transition effectiveness and flow optimization potential
- Outcome measurement alignment with customer value perception and satisfaction
C – Customer Segment Revenue Impact Analysis

Analyze revenue leak patterns across different customer segments to prioritize optimization efforts based on financial impact and resolution feasibility.
High-Value Segment Analysis: Focus optimization efforts on customers with greatest revenue potential:
Enterprise Customer Journey Optimization: Address complex B2B buying processes and organizational decision-making:
- Multi-stakeholder engagement analysis and consensus-building support optimization
- Procurement process navigation assistance and vendor evaluation facilitation
- Implementation planning and change management support for adoption success
- Account expansion opportunity identification and executive relationship development
High-Growth Customer Identification: Optimize journeys for customers showing scaling potential:
- Usage growth pattern analysis and expansion readiness assessment
- Budget cycle alignment and investment planning support optimization
- Success milestone achievement and celebration integration for relationship strengthening
- Referral network development and advocacy cultivation for organic growth
Retention Risk Segment Focus: Prevent revenue loss from vulnerable customer populations:
- Churn risk indicator development and early intervention trigger establishment
- Customer health scoring and proactive engagement protocol implementation
- Win-back campaign development for recently churned customers with recovery potential
- Competitive threat response and differentiation reinforcement for at-risk accounts
Segment-Specific Optimization Strategies: Tailor journey improvements to different customer characteristics:
- Industry-specific journey customization addressing sector-unique challenges and requirements
- Company size-appropriate experience design matching organizational complexity and resource levels
- Geographic and cultural adaptation for global customer base optimization
- Product usage pattern alignment with customer success objectives and value realization
O – Opportunity Prioritization Matrix
Transform friction point identification into actionable improvement roadmaps based on revenue impact potential and implementation complexity assessment.
Impact vs. Effort Analysis: Prioritize optimization initiatives using systematic evaluation criteria:
High-Impact, Low-Effort Opportunities (Quick Wins – 0-30 days):
- Communication clarity improvements reducing customer confusion and support burden
- Process simplification eliminating unnecessary steps and reducing abandonment
- Technology bug fixes preventing customer frustration and transaction failure
- Content optimization providing better guidance and decision support
High-Impact, High-Effort Opportunities (Strategic Initiatives – 30-90 days):
- System integration projects enabling seamless cross-platform customer experience
- Process redesign initiatives streamlining complex workflows and approval requirements
- Staff training programs improving customer interaction quality and problem resolution
- Technology platform upgrades enabling advanced personalization and automation

Revenue Impact Calculation: Quantify potential value from friction elimination:
- Customer lifetime value improvement from increased satisfaction and reduced churn
- Conversion rate optimization impact on acquisition efficiency and marketing ROI
- Average transaction value increase from reduced abandonment and improved completion rates
- Operational cost reduction through decreased support burden and improved efficiency
Implementation Feasibility Assessment: Evaluate organizational capacity and resource requirements:
- Technical complexity and integration requirements for system and process changes
- Staff training needs and capability development requirements for success
- Budget allocation and resource availability for improvement initiative implementation
- Timeline estimation and milestone planning for progress measurement and accountability
V – Velocity Implementation Planning
Create rapid implementation approaches that deliver measurable revenue recovery within 90 days while building sustainable optimization capabilities.
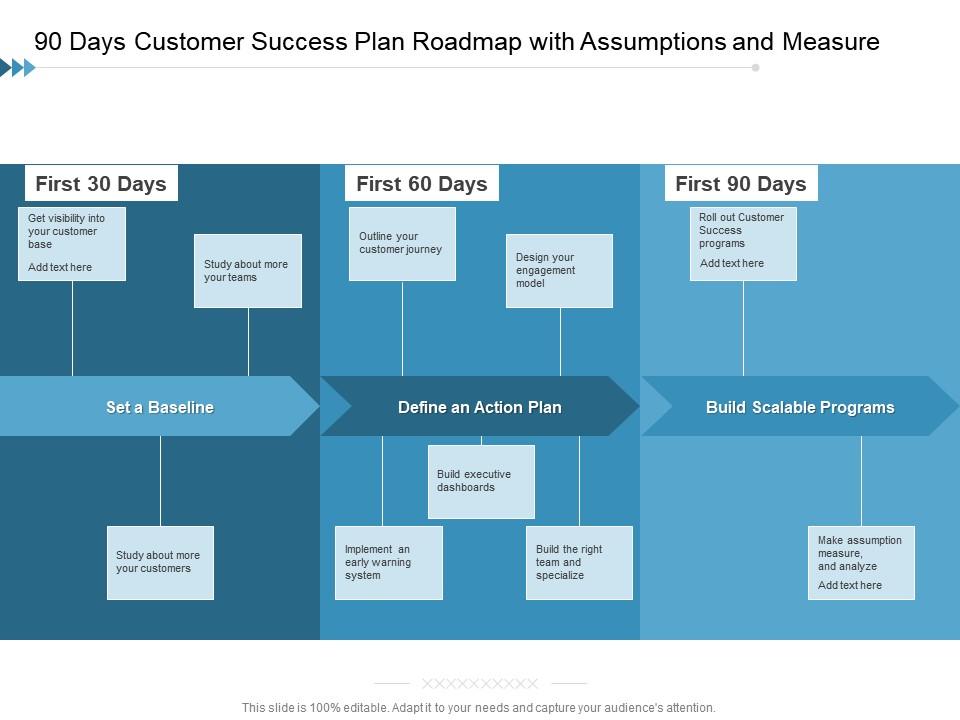
90-Day Sprint Framework: Structure improvement efforts for maximum impact and organizational learning:
Days 1-30: Foundation and Quick Wins:
- Implement high-impact, low-effort improvements with immediate customer benefit
- Establish baseline measurement systems for tracking progress and outcome validation
- Create cross-functional optimization teams with clear accountability and success metrics
- Launch customer feedback collection systems for ongoing insight generation and validation
Days 31-60: Strategic Implementation:
- Deploy medium-complexity improvements requiring coordination and resource allocation
- Begin advanced analytics implementation for predictive optimization and intervention
- Expand optimization efforts to additional customer segments and journey stages
- Develop automated monitoring and alert systems for ongoing friction detection
Days 61-90: Advanced Optimization and Scaling:
- Complete high-impact strategic initiatives with comprehensive measurement and validation
- Implement predictive analytics for proactive friction prevention and customer success
- Create systematic optimization processes for continuous improvement and innovation
- Establish organizational capability for ongoing journey optimization and revenue protection
Resource Allocation Strategy: Optimize team deployment and budget allocation for maximum impact:
- Cross-functional team formation with representatives from all customer-facing departments
- External expertise integration for specialized analytics and optimization capabilities
- Technology investment prioritization based on ROI potential and strategic importance
- Success measurement and reporting systems for stakeholder communication and buy-in
E – Engagement Monitoring and Optimization
Implement real-time tracking systems that identify emerging friction points before they become significant revenue leaks.
Continuous Monitoring Systems: Create automated detection and response capabilities:
Real-Time Journey Analytics: Monitor customer behavior patterns and identify deviation from optimal paths:
- Funnel analysis with automated alerting for conversion rate changes and abandonment increases
- Customer sentiment tracking through interaction analysis and feedback integration
- Competitive intelligence monitoring for market condition changes affecting customer behavior
- Seasonal pattern recognition and proactive optimization for cyclical business variations
Predictive Intervention Systems: Use analytics to prevent revenue leaks before they occur:
- Churn risk scoring with automated retention campaign triggers and personalized intervention
- Expansion opportunity identification and automated outreach for account growth
- Customer health monitoring with proactive support and success management
- Payment failure prediction and automated recovery process initiation
Feedback Loop Integration: Connect customer insights to continuous optimization efforts:
- Regular customer satisfaction surveys with journey-specific feedback collection
- Customer advisory board input on experience quality and improvement priorities
- Front-line staff feedback on common customer issues and resolution effectiveness
- Competitive analysis and market intelligence integration for strategic optimization
Research from Stanford Graduate School of Business demonstrates that organizations with continuous journey monitoring achieve 234% better revenue leak prevention and 67% faster optimization cycles compared to periodic review approaches.
R – Results Measurement and Scaling
Establish comprehensive measurement systems that validate optimization effectiveness and guide scaling decisions for sustained revenue growth.
Revenue Impact Tracking: Measure concrete business outcomes from journey optimization:
Direct Revenue Recovery: Quantify immediate financial benefits from friction elimination:
- Conversion rate improvement and associated revenue increase from reduced abandonment
- Customer lifetime value enhancement through improved satisfaction and reduced churn
- Average transaction value increase from optimized upgrade and expansion pathways
- Operational cost reduction through decreased support burden and improved efficiency
Predictive Revenue Protection: Measure future revenue protection through improved customer relationships:
- Churn risk reduction and associated retention revenue preservation
- Net Promoter Score improvement and referral revenue generation potential
- Customer health score enhancement and expansion revenue opportunity increase
- Competitive resilience improvement and market share protection
Organizational Capability Development: Track improvement in systematic optimization capabilities:
- Analytics maturity advancement and insight generation improvement
- Cross-functional collaboration effectiveness and optimization speed
- Customer-centric culture development and experience prioritization
- Continuous improvement process effectiveness and innovation acceleration

Scaling Strategy Development: Use success patterns to expand optimization across the organization:
- Proven methodology application to additional customer segments and journey stages
- Best practice documentation and knowledge transfer for organizational learning
- Technology platform evolution and capability enhancement for advanced optimization
- Market leadership positioning through superior customer experience and journey optimization
Advanced Analytics Techniques for Revenue Leak Detection
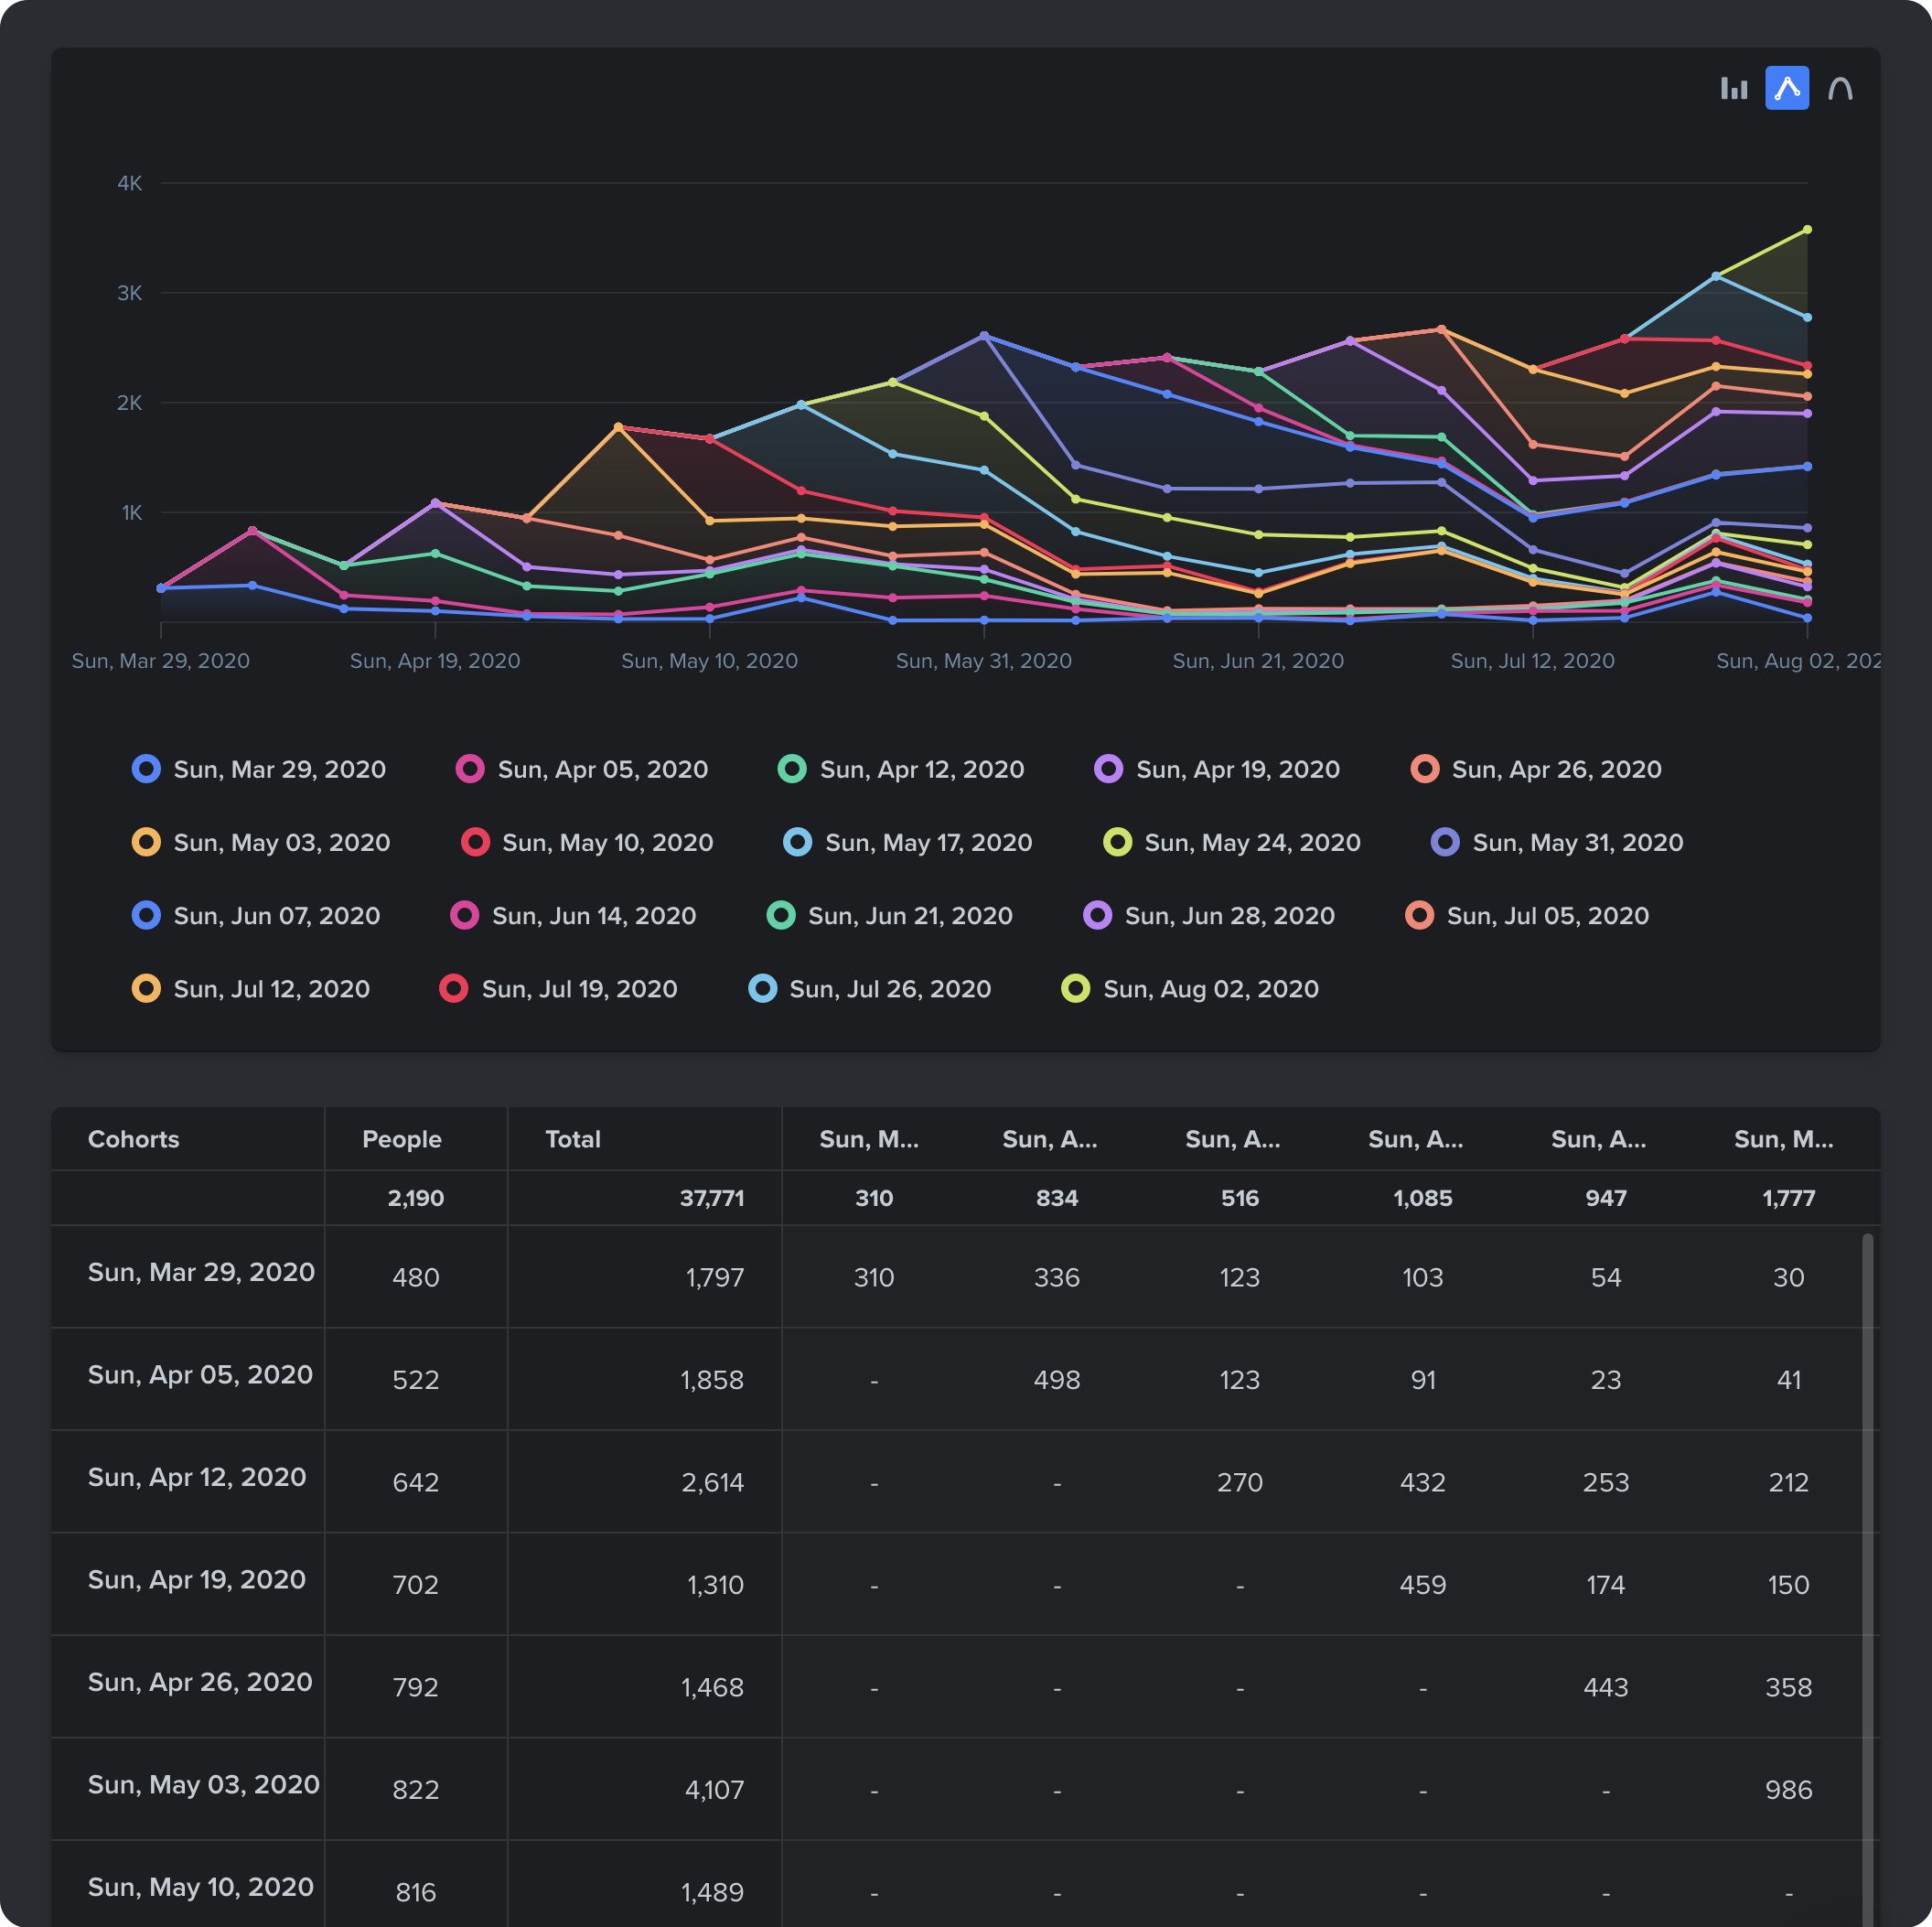
Cohort Analysis for Journey Optimization

Track customer groups through complete journey experiences to identify optimization opportunities and measure long-term revenue impact.
Acquisition Cohort Journey Analysis: Compare revenue outcomes across customers acquired during different periods:
- Seasonal acquisition impact on journey completion and long-term value generation
- Marketing channel influence on journey experience quality and subsequent revenue potential
- Onboarding experience correlation with retention rates and expansion revenue
- Competitive landscape impact on customer expectations and journey optimization requirements
Feature Adoption Cohort Tracking: Evaluate how journey improvements impact customer success and revenue generation:
- New journey element impact on customer satisfaction and completion rates
- Process optimization effects on customer effort and experience quality
- Technology enhancement results showing efficiency gains and revenue improvements
- Communication improvement outcomes demonstrating clarity gains and reduced support burden
![]()
Machine Learning for Predictive Revenue Protection
Implement advanced analytics that forecast potential revenue leaks and enable proactive intervention before customer value is lost.
Churn Prediction Modeling: Identify customers at risk of revenue loss before traditional indicators become apparent:
- Behavioral pattern analysis revealing early warning signs of customer dissatisfaction
- Engagement decline detection and automated intervention trigger systems
- Support interaction analysis predicting escalation risk and proactive resolution needs
- Payment behavior changes indicating potential churn risk and recovery opportunities

Expansion Revenue Optimization: Use predictive analytics to identify and capture growth opportunities:
- Usage pattern analysis revealing readiness for premium features or service upgrades
- Stakeholder engagement measurement showing expansion conversation readiness
- Budget cycle alignment and optimal timing for expansion discussions and proposals
- Success milestone achievement correlation with upgrade willingness and capacity
Building on insights from our exploration of data-driven decision making for non-technical founders, these advanced techniques help organizations scale revenue optimization without requiring extensive technical expertise.
Technology Implementation for Journey Analytics
Customer Data Platform Integration

Create unified customer journey visibility by connecting data from all touchpoints and interaction channels.
Essential Data Integration Requirements: Connect systems that impact customer journey experience and revenue outcomes:
Customer Relationship Management (CRM) Integration: Link sales and account management data with journey analytics:
- Opportunity pipeline analysis and conversion optimization based on journey experience quality
- Account expansion tracking and correlation with journey satisfaction and engagement
- Customer communication history and personalization effectiveness measurement
- Sales process efficiency and customer experience impact assessment
Customer Support System Connection: Integrate service interactions with journey optimization efforts:
- Ticket theme analysis revealing systemic journey problems requiring attention
- Resolution effectiveness measurement and customer satisfaction correlation
- Self-service utilization and journey education effectiveness evaluation
- Escalation pattern identification and proactive intervention opportunity development
Marketing Automation Platform Alignment: Connect campaign effectiveness with journey experience outcomes:
- Campaign response analysis and journey stage effectiveness measurement
- Content engagement correlation with conversion and retention success
- Personalization effectiveness and customer journey progression optimization
- Attribution modeling showing marketing contribution to journey completion and revenue generation
Billing and Payment System Integration: Monitor revenue recognition and payment experience quality:
- Payment failure analysis and recovery process effectiveness measurement
- Billing dispute correlation with journey experience and satisfaction levels
- Subscription management effectiveness and customer retention correlation
- Pricing optimization and customer value perception alignment assessment
Real-Time Analytics and Intervention Systems
Implement technology platforms that enable immediate response to journey friction and revenue leak indicators.
Automated Alert Systems: Create responsive monitoring that identifies problems before they become significant revenue losses:
- Conversion rate threshold alerts triggering immediate investigation and response
- Customer satisfaction score changes indicating experience degradation requiring attention
- Support ticket volume spikes revealing emerging journey problems and optimization needs
- Payment failure increases suggesting billing process issues requiring immediate resolution
Dynamic Personalization Engines: Adjust customer experiences in real-time based on journey analytics and optimization insights:
- Content personalization based on customer journey stage and demonstrated preferences
- Offer optimization using behavioral data and response pattern analysis
- Communication timing and channel selection based on individual customer engagement patterns
- Support routing and escalation based on customer value and risk assessment

Collaborative Optimization Platforms: Enable cross-functional teams to coordinate journey improvement efforts:
- Shared analytics dashboards providing unified customer journey visibility across departments
- Project management integration for optimization initiative tracking and accountability
- Communication tools facilitating rapid response to emerging issues and opportunities
- Knowledge management systems capturing optimization insights and best practices
As discussed in our guide to transforming data chaos into customer clarity, successful technology implementation requires balancing analytical sophistication with organizational capability and practical business requirements.
Industry-Specific Revenue Leak Patterns
SaaS and Technology: Subscription Revenue Optimization

Technology companies face unique revenue leak challenges related to usage-based pricing, feature adoption, and subscription lifecycle management.
Common SaaS Revenue Leak Sources:
- Trial-to-paid conversion obstacles creating customer acquisition inefficiency and marketing waste
- Feature adoption barriers preventing customers from realizing value and increasing churn risk
- Usage-based billing confusion leading to customer dissatisfaction and subscription cancellations
- Upgrade pathway complexity reducing expansion revenue and account growth potential
SaaS-Specific Optimization Strategies:
- Onboarding experience optimization ensuring rapid time-to-value and adoption success
- In-app guidance systems reducing confusion and accelerating feature discovery
- Usage analytics and customer success intervention for proactive value demonstration
- Pricing transparency and communication improvement for billing clarity and satisfaction
E-commerce: Transaction and Customer Experience Optimization
Technology companies face unique revenue leak challenges related to usage-based pricing, feature adoption, and subscription lifecycle management.
Common E-commerce Revenue Leak Sources:
- Shopping cart abandonment due to complex checkout processes and unexpected costs
- Product discovery difficulties preventing customers from finding desired items
- Shipping and return policy confusion creating purchase hesitation and abandonment
- Customer service accessibility problems reducing satisfaction and repeat purchases
E-commerce Optimization Strategies:
- Checkout process simplification and guest purchase option implementation
- Search and navigation improvement for better product discovery and conversion
- Shipping cost transparency and delivery option clarity for purchase confidence
- Customer service channel optimization and accessibility improvement
Professional Services: Client Relationship and Project Revenue Protection
Service businesses face revenue leaks through project scope creep, client satisfaction issues, and renewal negotiation challenges.
Common Professional Services Revenue Leak Sources:
- Project management inefficiency creating budget overruns and client dissatisfaction
- Communication gaps leading to scope misalignment and relationship deterioration
- Value demonstration difficulties affecting renewal rates and expansion opportunities
- Competitive differentiation challenges impacting pricing power and market position
Professional Services Optimization Strategies:
- Project communication and milestone tracking system implementation
- Client success measurement and regular check-in process development
- Value reporting and business impact demonstration for renewal preparation
- Competitive positioning and unique value proposition clarification
Measuring 90-Day Reset Success
Financial Impact Assessment

Track concrete revenue improvements attributable to journey optimization and friction elimination efforts.
Direct Revenue Metrics: Measure immediate financial benefits from optimization implementation:
- Monthly Recurring Revenue (MRR) growth rate acceleration through improved retention and expansion
- Customer Acquisition Cost (CAC) reduction via conversion rate optimization and efficiency gains
- Customer Lifetime Value (CLV) improvement through satisfaction enhancement and churn reduction
- Average Revenue Per User (ARPU) increase via successful upselling and cross-selling optimization
Revenue Quality Indicators: Evaluate improvement in revenue predictability and sustainability:
- Churn rate reduction and associated revenue protection through journey optimization
- Net Revenue Retention (NRR) improvement showing expansion success and customer satisfaction
- Payment success rate improvement reducing involuntary churn and billing friction
- Referral revenue generation increase through customer satisfaction and advocacy development

Customer Experience Enhancement Metrics
Monitor qualitative improvements in customer relationships and satisfaction attributable to journey optimization.
Customer Satisfaction Indicators: Track relationship quality improvements and experience enhancement:
- Net Promoter Score (NPS) improvement showing customer advocacy and referral willingness increase
- Customer Effort Score (CES) reduction indicating easier, more convenient experience delivery
- Customer Satisfaction (CSAT) score enhancement across all journey touchpoints and interactions
- Customer health score improvement showing engagement deepening and relationship strengthening

Behavioral Engagement Metrics: Measure increased customer participation and journey completion:
- Feature adoption rate improvement showing value realization and product engagement deepening
- Support ticket volume reduction indicating self-service effectiveness and experience clarity
- Time-to-value achievement acceleration through onboarding optimization and guidance improvement
- Renewal rate improvement showing satisfaction and continued value perception
According to McKinsey & Company research, organizations implementing comprehensive customer journey optimization achieve 67% higher revenue growth and 45% better profit margins compared to companies relying on traditional improvement approaches.
Common Implementation Challenges and Solutions
The Perfectionism Paralysis

Many organizations delay journey optimization while pursuing comprehensive analytics and perfect customer understanding across all touchpoints.
Practical Implementation Approach:
- Start with highest-revenue-impact journey segments before attempting complete optimization
- Focus on measurable improvements with clear ROI rather than perfect customer experience
- Implement iterative optimization cycles allowing learning and adjustment over time
- Build organizational capability through practice rather than theoretical preparation
The Technology-First Trap
Some companies focus on implementing sophisticated journey analytics tools without developing organizational optimization capabilities.
Capability-First Development:
- Understand current journey friction sources before investing in tracking technology
- Develop cross-functional collaboration processes for optimization before automating analysis
- Train teams in customer-centric thinking and journey optimization principles
- Measure journey improvement impact on business outcomes before expanding technological complexity

The Silo Problem
Revenue leaks often occur at departmental boundaries where different teams manage journey segments without coordination.
Cross-Functional Integration:
- Create journey ownership accountability spanning multiple departments and functions
- Establish shared success metrics connecting departmental activities to customer outcomes
- Implement regular cross-functional reviews and optimization planning sessions
- Design incentive alignment encouraging collaboration and shared journey optimization success
Building on our analysis of narrative analytics outperforming raw dashboards, successful journey optimization requires organizational alignment around customer-centric metrics and shared improvement objectives.
The Future of Customer Journey Revenue Optimization
Artificial Intelligence and Predictive Journey Optimization
AI-powered analytics will enable unprecedented accuracy in predicting and preventing revenue leaks before they occur.
Emerging AI Capabilities:
- Real-time journey personalization based on individual customer behavior prediction and optimization
- Automated friction detection using machine learning pattern recognition and anomaly identification
- Predictive intervention systems preventing customer churn and revenue loss before traditional indicators emerge
- Natural language processing of customer feedback revealing emerging journey problems and optimization opportunities
Integrated Customer Experience Platforms
Technology evolution will enable seamless journey orchestration across all customer touchpoints and interaction channels.

Platform Integration Advances:
- Unified customer data platforms providing real-time journey visibility across all systems
- Automated journey orchestration enabling consistent experience delivery regardless of channel
- Cross-channel personalization maintaining context and continuity throughout customer interactions
- Integrated optimization capabilities allowing real-time journey adjustment based on performance data
Behavioral Economics Integration
Understanding customer psychology and decision-making patterns will enable more effective journey design and optimization.
Behavioral Optimization Opportunities:
- Cognitive bias recognition and journey design optimization for improved decision-making
- Emotional journey mapping connecting customer feelings to experience design and satisfaction
- Social proof integration leveraging peer influence for journey completion and advocacy
- Behavioral nudging techniques encouraging desired customer actions and journey progression
As we explored in our guide to the psychology of data storytelling, understanding human behavior is crucial for designing customer experiences that drive both satisfaction and revenue optimization.
Taking Action: Your 90-Day Implementation Roadmap

The transformation from revenue leaking to revenue optimization doesn’t require perfect systems—it requires systematic progress toward customer journey understanding and friction elimination.
Phase 1: Revenue Flow Assessment (Days 1-30)
Week 1: Current State Analysis
- Map existing customer journey touchpoints and identify all revenue-generating interactions
- Audit current analytics and measurement capabilities for journey visibility and friction detection
- Document known customer pain points and support themes indicating systemic journey problems
- Establish baseline metrics for conversion rates, retention rates, and customer satisfaction across journey stages
Week 2: Revenue Leak Detection
- Analyze customer behavior data to identify abandonment patterns and conversion obstacles
- Review customer feedback and support interactions for journey friction indicators
- Conduct revenue flow analysis showing where customers exit processes and associated financial impact
- Prioritize friction points based on revenue impact potential and resolution feasibility
Week 3: Quick Win Implementation
- Implement immediate improvements to highest-impact, lowest-effort friction points
- Optimize communication clarity and process simplification for immediate customer benefit
- Launch enhanced customer feedback collection for ongoing insight generation
- Begin staff training on customer journey awareness and optimization principles
Week 4: Measurement System Setup
- Implement analytics tracking for journey performance measurement and optimization guidance
- Establish success metrics connecting journey improvements to revenue outcomes and business objectives
- Create reporting systems for ongoing monitoring and optimization accountability
- Design cross-functional collaboration processes for coordinated improvement efforts
Phase 2: Strategic Optimization (Days 31-60)

Week 5-6: Cross-Functional Team Formation
- Create journey optimization teams with representatives from all customer-facing departments
- Establish shared accountability and success metrics for collaborative improvement efforts
- Design communication and coordination processes for rapid response to emerging issues
- Implement regular review cycles for progress measurement and optimization planning
Week 7-8: Advanced Analytics Implementation
- Deploy sophisticated journey analytics for predictive optimization and proactive intervention
- Integrate customer data from multiple systems for comprehensive journey visibility
- Implement automated monitoring and alerting for emerging friction points and optimization opportunities
- Create predictive models for churn prevention and expansion opportunity identification
Phase 3: Results Measurement and Scaling (Days 61-90)
Week 9-10: Optimization Results Validation
- Measure revenue impact from journey improvements and friction elimination efforts
- Assess customer satisfaction enhancement and behavioral engagement improvement
- Document successful optimization approaches and organizational learning for scaling
- Refine measurement systems and success metrics based on actual outcomes and insights
Week 11-12: Scaling and Continuous Improvement
- Expand successful optimization approaches to additional customer segments and journey stages
- Create systematic processes for ongoing journey monitoring and improvement
- Establish organizational capabilities for continuous optimization and innovation
- Design long-term strategic plans for sustained revenue growth through customer experience excellence

Conclusion: The Journey from Revenue Leak to Revenue Growth
The companies thriving in today’s competitive landscape aren’t necessarily those with the best products—they’re organizations that best optimize the complete customer journey from first contact to long-term advocacy.
Revenue leaks aren’t inevitable costs of doing business; they’re optimization opportunities waiting to be discovered and eliminated. Every friction point represents potential revenue that can be recovered through systematic journey improvement and customer experience enhancement.
Your competitors face similar customer journey challenges and revenue leak opportunities. Your advantage lies in recognizing these challenges first and implementing systematic solutions that transform customer experience while protecting and growing revenue.
The 90-day customer journey reset isn’t just about fixing problems—it’s about building organizational capabilities for continuous optimization and sustainable competitive advantage through superior customer experience delivery.
The analytics exist. The frameworks are proven. The revenue is waiting to be recovered.
The only question is: will you continue letting friction silently drain your growth potential, or will you implement the systematic optimization that transforms customer journey obstacles into revenue acceleration opportunities?
Frequently Asked Questions
Q: How do I know if my company has significant revenue leaks worth addressing? A: Look for disconnect between customer acquisition investment and revenue growth rates, unexplained churn in seemingly satisfied customers, and conversion rate variations across similar customer segments. Most companies lose 15-25% of potential revenue to unaddressed journey friction.
Q: Can small businesses implement customer journey analytics without enterprise-level technology? A: Absolutely. Start with Google Analytics, customer feedback surveys, and basic CRM analysis. Many significant revenue leaks are discoverable through simple customer interview and behavior observation. Technology sophistication should match organizational capability and improvement impact.
Q: What’s the typical ROI timeline for customer journey optimization investments? A: Most organizations see initial revenue impact within 30-60 days from quick friction elimination, with substantial ROI achievement within 6-12 months. Revenue leak prevention typically generates 3-5x ROI through improved conversion, retention, and expansion outcomes.
Q: How do I prioritize which journey friction points to address first? A: Focus on high-revenue-impact, low-implementation-effort opportunities first. Calculate potential revenue recovery from conversion rate improvements, then assess resource requirements for resolution. Quick wins build momentum and justify larger optimization investments.
Q: Should I hire specialists or use existing team members for journey optimization? A: Start with existing team cross-functional collaboration before adding specialists. Customer journey optimization requires business context and customer understanding more than technical expertise. Add specialized analytics support after establishing organizational optimization capabilities.
Q: How do I measure success when customer journeys span multiple touchpoints and timeframes? A: Use cohort analysis to track customer groups through complete experiences, implement multi-touch attribution for conversion credit, and establish leading indicators (engagement, satisfaction) that predict lagging outcomes (revenue, retention). Focus on trend improvement rather than perfect measurement.
Q: What if customer journey optimization reveals problems requiring significant technology or process changes? A: Start with workarounds and temporary solutions that improve customer experience while planning longer-term systematic fixes. Many revenue leaks can be reduced through communication improvement and staff training before requiring major technology investments.
Ready to eliminate revenue leaks and optimize your customer journey for sustained growth? At Pivot BI Analytics LLC, we specialize in helping organizations implement the RECOVER framework that identifies and eliminates revenue leaks within 90 days. Our systematic approach has helped 200+ companies recover an average of $247K in monthly recurring revenue while building sustainable optimization capabilities.
Contact us today for a complimentary Revenue Leak Assessment designed specifically for businesses ready to transform customer journey friction into revenue growth acceleration.
This evolution from revenue bleeding to revenue optimization isn’t just about fixing problems—it’s about building sustainable competitive advantages through superior customer experience and systematic journey improvement that compounds into long-term market leadership.
The journey from leak detection to revenue recovery is clear. The tools are accessible. The revenue is recoverable. The only question is: will you start your 90-day reset today, or will your competitors capture the revenue that should be yours?