
The brutal truth about business analytics that no vendor wants you to know—and the framework that’s helping the successful 13% achieve remarkable results.

Sarah Chen thought she was making a smart investment. As CEO of Pacific Manufacturing, a $3.2M precision parts company, she’d watched her larger competitors leverage data to streamline operations and boost profits. So when a consulting firm pitched a comprehensive BI solution for $47,000, she didn’t hesitate.
Six months later, Sarah’s team was still making decisions the same way they always had—with gut instincts, outdated spreadsheets, and heated debates in conference rooms. The beautiful dashboards sat unused. The real-time reports gathered digital dust. The promised “data-driven transformation” never materialized.
Sarah’s story isn’t unique. It’s tragically common.
The $2.3 Billion Analytics Disaster Plaguing SMEs
Recent industry research reveals a stunning reality: 87% of small and medium enterprise data projects fail to deliver their promised business value. That’s not just disappointing—it’s financially devastating.
When you calculate the total investment SMEs make annually in analytics tools, implementation services, training, and lost opportunity costs, the number exceeds $2.3 billion in wasted resources. Forbes confirms that most SMEs struggle with BI implementation, often investing in solutions that don’t align with their actual business needs.
But here’s what makes this particularly painful: the successful 13% aren’t using more expensive tools or hiring bigger teams. They’re doing something fundamentally different with their data—something that transforms numbers into narratives that drive real business action.
The Hidden Costs of Failed Analytics Projects:
- Direct tool and implementation costs: $15,000-$85,000 per failed project
- Lost productivity during transition periods: 15-30% decline for 3-6 months
- Opportunity cost of delayed decision-making: Immeasurable but significant
- Team morale impact from yet another “failed initiative”: Often overlooked but critical

The data is even more sobering when you examine specific industries. Manufacturing SMEs report 92% failure rates on analytics initiatives, while professional services companies fare slightly better at 84%. Retail and hospitality businesses fall somewhere in between, with 89% of data projects failing to generate meaningful ROI.
The Fatal Flaw in Traditional Business Intelligence Approaches
Traditional BI approaches fail SMEs because they’re built on a fundamentally flawed assumption: that better data automatically leads to better decisions. This assumption works in large enterprises with dedicated analytics teams and data scientists, but it crumbles in the SME environment.
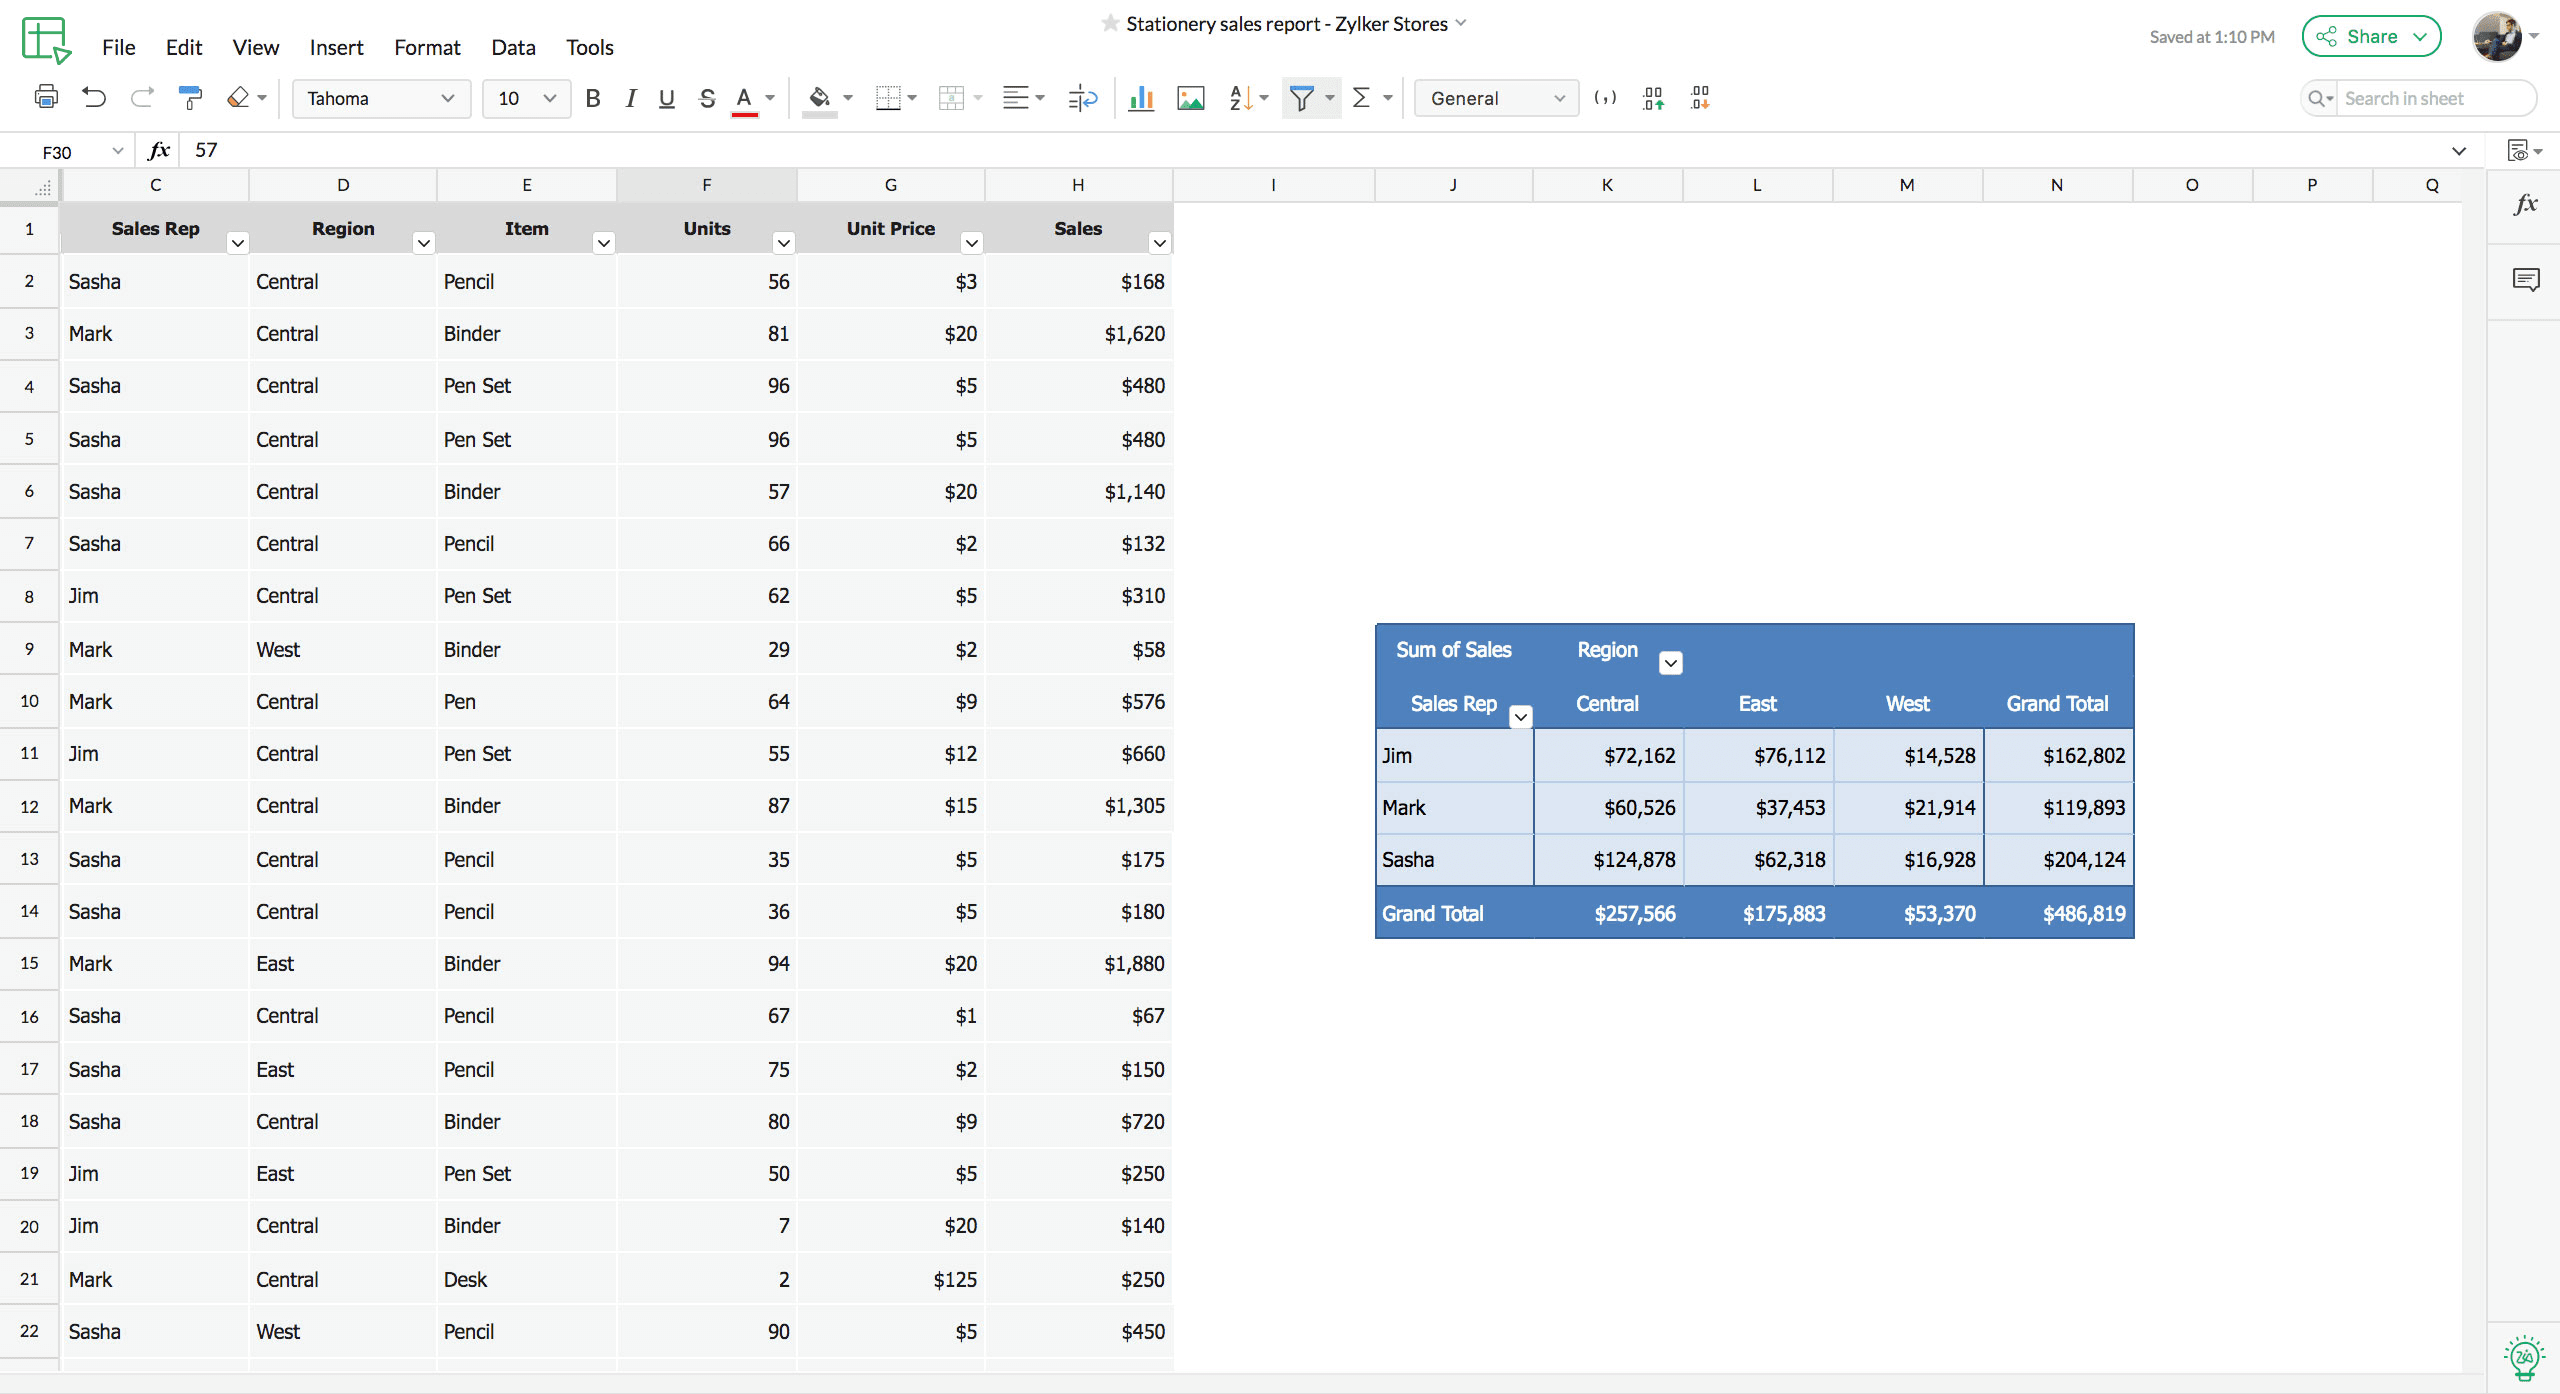
Consider Marcus Rodriguez, operations director at a $2.1M logistics company. His team invested heavily in a popular BI platform, creating dozens of sophisticated dashboards tracking everything from delivery times to fuel costs. The data was accurate, the visualizations were beautiful, and the insights were technically sound.
But when Marcus presented monthly performance reviews to his executive team, eyes glazed over. When he shared “actionable insights” with frontline managers, they nodded politely and continued their existing workflows. The problem wasn’t the data—it was the complete absence of story.
Why Traditional BI Fails SMEs:
- Information Overload: Too many metrics without clear priorities
- Context Vacuum: Data presented without business narrative
- Action Gap: Insights that don’t translate to specific next steps
- Stakeholder Disconnect: Technical presentations for business audiences
The missing ingredient that transforms data from noise to gold is the ability to weave information into compelling narratives that resonate with human decision-makers—what industry leaders call “data storytelling.”
This challenge becomes even more pronounced when you consider the typical SME decision-making environment. Unlike large corporations with structured processes and dedicated analytics staff, SMEs operate in fast-paced, resource-constrained settings where business leaders wear multiple hats and make rapid-fire decisions based on incomplete information.
Data Storytelling: The Game-Changing Framework SMEs Need
Data storytelling isn’t just about making prettier charts or adding narrative text to reports. It’s a systematic methodology that transforms raw information into persuasive business intelligence that drives action.
The framework consists of four interconnected pillars that successful SMEs use to achieve exceptional results—like Portland-based TechFlow Solutions, which used data storytelling to identify a hidden revenue opportunity worth $1.2M annually, or Denver’s Alpine Consulting, which reduced client churn by 34% after implementing narrative-driven customer journey analysis.

Let’s examine each pillar that separates the winning 13% from the struggling majority:
Pillar 1: Context-Driven Data Selection
Most SMEs suffer from “data hoarding syndrome”—collecting every possible metric without understanding which insights actually influence business outcomes. Successful data storytelling begins with ruthless prioritization.
The context-driven approach asks three critical questions before analyzing any data:
- What specific business decision needs to be made?
- Who will act on this information, and what drives their choices?
- What would success look like, and how would we measure it?
This approach helped Marina Packaging, a $1.8M specialty printing company, focus their analytics efforts on the 12% of metrics that directly impacted their profit margins, rather than the 200+ data points their previous system tracked.
The transformation was remarkable. Instead of drowning in comprehensive reports, Marina’s leadership team received focused insights about three critical areas: customer acquisition costs, production efficiency rates, and cash flow patterns. This focused approach enabled them to identify a pricing optimization opportunity that increased margins by 18% within four months.
Pillar 2: Narrative Arc Construction
Every compelling story has a beginning, middle, and end. Business data stories are no different. The most effective analytics presentations follow a proven narrative structure:
- The Setup: Current business situation and challenges
- The Conflict: Problems revealed by data analysis
- The Resolution: Specific actions that address identified issues
- The Outcome: Projected results and success metrics
This structure transforms confusing spreadsheets into clear, actionable business intelligence that stakeholders can immediately understand and act upon.
Consider how Riverside Consulting, a $950K professional services firm, used this narrative approach to address a client retention crisis. Instead of presenting raw churn statistics, they crafted a story:
Setup: “Our client retention has been declining for six months, threatening our growth projections.”
Conflict: “Data analysis reveals that 73% of departing clients cite poor communication during project delivery as their primary concern.”
Resolution: “We need to implement weekly client check-ins and automated progress reporting to address this communication gap.”
Outcome: “This initiative should reduce churn by 25% and increase client lifetime value by $47,000 annually.”
This narrative approach led to immediate action and measurable results—something their previous data-heavy presentations never achieved.
Pillar 3: Stakeholder-Specific Visualization
Different audiences need different types of information presented in different ways. A CFO wants financial impact and ROI projections. An operations manager needs process improvements and efficiency gains. A CEO requires strategic insights and competitive positioning.
Successful data storytelling customizes both content and presentation style for each stakeholder group, ensuring that every insight lands with maximum impact and clarity.
The power of stakeholder-specific visualization became evident at Northwest Distribution, a $2.7M logistics company. Their previous analytics approach used identical dashboards for all management levels, resulting in confusion and inaction.
After implementing stakeholder-specific data stories, their results improved dramatically:
- Executive presentations focused on strategic metrics and competitive positioning
- Department manager reports emphasized operational efficiency and team performance
- Frontline supervisor updates highlighted daily productivity and problem areas
This targeted approach increased analytics engagement by 340% and led to faster, more informed decision-making across all organizational levels.
Pillar 4: Action-Oriented Insight Delivery
The ultimate test of any analytics project is simple: does it change behavior? Effective data stories don’t just inform—they inspire specific actions with clear accountability and measurable outcomes.
This means every insight presentation should end with concrete next steps, assigned ownership, and success metrics that can be tracked and reported.
Action-oriented delivery distinguishes successful SME analytics from the dashboard graveyards that plague most organizations. Instead of presenting information for passive consumption, data storytelling creates momentum for immediate business action.
Beyond Tableau Next: Choosing the Right Analytics Stack for SMEs
While industry giants like Tableau continue innovating with solutions like Tableau Next—their new agentic analytics platform that integrates AI-powered insights with Salesforce’s Agentforce—SMEs need to make more practical considerations.
The key isn’t finding the most advanced platform; it’s identifying tools that align with your team’s capabilities, budget constraints, and specific business needs.
SME Analytics Stack Evaluation Framework:
- User Experience: Can non-technical team members create meaningful insights?
- Implementation Speed: How quickly can you see value from day one?
- Scalability: Will the solution grow with your business needs?
- Total Cost of Ownership: Beyond licensing, what are the hidden costs?
- Integration Capabilities: How well does it work with your existing systems?
Many successful SMEs find that mid-market solutions like Zoho Analytics, Sisense, or even well-implemented Google Data Studio setups outperform enterprise platforms when paired with strong data storytelling capabilities.
The surprising alternative that’s outperforming enterprise solutions for many SMEs? Custom-built narrative dashboards using business intelligence tools combined with presentation platforms that prioritize story over raw data display.
Practical Tool Recommendations for SMEs:
For Startups ($0-500K revenue):
- Google Data Studio + Google Sheets for basic analytics
- Zoho Analytics for integrated business intelligence
- Focus on manual data storytelling until processes mature
For Growing SMEs ($500K-$2M revenue):
- Power BI for Microsoft-integrated environments
- Tableau Creator for visualization-heavy requirements
- Sisense for user-friendly advanced analytics
For Established SMEs ($2M+ revenue):
- Tableau Desktop + Tableau Server for comprehensive BI
- Qlik Sense for self-service analytics
- Custom solutions with embedded analytics capabilities
The critical success factor isn’t the specific tool—it’s ensuring that whatever platform you choose supports your data storytelling methodology rather than creating additional complexity.
The 30-Day Data Storytelling Implementation Roadmap
Transforming your analytics approach doesn’t require months of planning or massive resource investments. Here’s the proven 30-day roadmap that helps SMEs join the successful 13%:

Week 1: Foundation Setting
- Day 1-2: Audit current analytics tools and processes
- Day 3-4: Identify top 3 business decisions that need data support
- Day 5-6: Map stakeholder needs and communication preferences
- Day 7: Establish success metrics for transformation
Week 1 Deliverables:
- Current state analytics assessment
- Priority decision framework
- Stakeholder communication matrix
- Success measurement plan
Week 2: Data Story Framework Development
- Day 8-10: Select pilot use case for first data story
- Day 11-12: Implement context-driven data selection process
- Day 13-14: Create stakeholder-specific presentation templates
- Day 14: Train core team on narrative arc construction
Week 2 Deliverables:
- Pilot project scope and objectives
- Data selection criteria and process
- Presentation template library
- Team training completion
Week 3: Story Creation and Testing
- Day 15-18: Develop first complete data story using new framework
- Day 19-20: Test presentation with target stakeholder group
- Day 21: Gather feedback and refine approach
- Day 21: Document lessons learned and best practices
Week 3 Deliverables:
- Complete pilot data story presentation
- Stakeholder feedback analysis
- Process refinement recommendations
- Best practices documentation
Week 4: Scaling and Optimization
- Day 22-24: Roll out framework to additional use cases
- Day 25-27: Create standardized templates and processes
- Day 28-29: Establish regular storytelling review cycles
- Day 30: Plan next phase of implementation
Week 4 Deliverables:
- Scaled implementation plan
- Standardized process documentation
- Regular review schedule
- Phase 2 roadmap
This roadmap transforms analytics from a technical exercise into a strategic business capability that drives measurable results. Companies following this approach typically see 40-60% improvement in decision-making speed and 25-35% increase in analytics-driven action within 60 days.
Measuring Success: KPIs That Actually Matter for SME Analytics
Most SMEs measure analytics success using vanity metrics like “number of reports generated” or “dashboard usage rates.” These metrics tell you nothing about business impact.
Successful data storytelling initiatives are measured by outcomes that directly connect to business performance:
Tier 1 Metrics (Business Impact):
- Decision-making speed improvement: Time reduction from data request to action
- Revenue influenced by data-driven insights: Dollars attributed to analytics-informed decisions
- Cost reductions attributed to analytics: Savings from optimization and efficiency gains
- Strategic initiative success rates: Percentage of data-supported projects achieving goals
Tier 2 Metrics (Process Improvement):
- Stakeholder engagement with analytics content: Attendance and participation in data presentations
- Time-to-insight for critical business questions: Speed of generating actionable intelligence
- Quality of business decisions: Success rate tracking over time
- Cross-functional collaboration on data projects: Inter-department analytics cooperation
Tier 3 Metrics (System Performance):
- Data accuracy and completeness: Quality metrics for underlying information
- Report generation efficiency: Time and resource requirements for insights
- User adoption and satisfaction scores: Team acceptance and utilization rates
- Technical system performance: Platform reliability and speed metrics
These metrics prove your analytics investment to even the most skeptical stakeholders by connecting data initiatives directly to bottom-line business results.
Real-World Success Stories: SMEs Winning with Data Storytelling
The power of data storytelling becomes clear when you examine specific SME transformations:
Case Study 1: Mountain View Manufacturing This $4.2M industrial components company struggled with inventory optimization. Traditional BI reports showed data but didn’t drive action. After implementing data storytelling:
- Reduced inventory carrying costs by 23% ($180,000 annually)
- Improved order fulfillment rates from 78% to 94%
- Decreased stockout incidents by 67%
The key was transforming inventory reports into compelling narratives about cash flow optimization and customer satisfaction.
Case Study 2: Coastal Marketing Services A $1.8M digital marketing agency faced client retention challenges. Their analytics showed churn patterns but didn’t inspire preventive action. Data storytelling transformation results:
- Increased client retention from 72% to 89%
- Grew average client lifetime value by 45%
- Reduced new client acquisition costs by 31%
Success came from crafting data stories that connected client behavior patterns to specific account management actions.
Case Study 3: Urban Logistics Solutions This $3.1M distribution company needed to optimize route efficiency. Standard reports provided metrics without context. After data storytelling implementation:
- Reduced fuel costs by 19% ($95,000 annually)
- Improved on-time delivery rates from 82% to 96%
- Increased driver productivity by 28%
The transformation involved creating narrative frameworks that connected route data to profitability and customer satisfaction outcomes.
Common Pitfalls and How to Avoid Them
Even with the best intentions, SMEs often make critical mistakes when implementing data storytelling:
Pitfall 1: Over-Complicating the Narrative Many teams try to include every data point in their stories, creating confusion instead of clarity.
Solution: Focus on 3-5 key insights per presentation. Less is more in effective data storytelling.
Pitfall 2: Ignoring Audience Needs Creating one-size-fits-all presentations that don’t resonate with specific stakeholders.
Solution: Develop audience personas and customize content for each group’s interests and decision-making authority.
Pitfall 3: Weak Call-to-Action Presenting compelling stories without clear next steps or accountability.
Solution: Every data story must end with specific actions, owners, and success metrics.
Pitfall 4: Inconsistent Implementation Starting strong but failing to maintain storytelling discipline over time.
Solution: Create standardized templates and regular review processes to ensure consistency.
The Future of SME Analytics: Emerging Trends and Opportunities
The analytics landscape continues evolving rapidly, with several trends particularly relevant for SMEs:
Trend 1: AI-Augmented Storytelling Tools like Tableau Next integrate artificial intelligence to help identify narrative opportunities in data. While powerful, SMEs should focus on fundamental storytelling skills before adding AI complexity.
Trend 2: Mobile-First Analytics Business leaders increasingly expect analytics insights on mobile devices. Data stories must be optimized for smartphone and tablet consumption.
Trend 3: Real-Time Narrative Updates Static monthly reports are giving way to dynamic stories that update as business conditions change. This requires more sophisticated technical infrastructure but delivers superior business value.
Trend 4: Collaborative Analytics Cross-functional teams are working together to create and refine data stories, breaking down traditional silos between IT and business functions.
SMEs that master fundamental data storytelling principles will be well-positioned to leverage these emerging capabilities as they become more accessible and affordable.
Transform Your Analytics Investment Into Competitive Advantage
The difference between the 87% of SMEs that fail with analytics and the 13% that succeed isn’t about having better technology or bigger budgets. It’s about understanding that data without story is just noise—but data with compelling narrative becomes the foundation for transformational business growth.
The companies winning with analytics share common characteristics:
- They prioritize business outcomes over technical features
- They invest in storytelling capabilities alongside technology
- They measure success through business impact rather than system metrics
- They maintain discipline in their narrative approach over time
Your analytics transformation starts with a single decision: Will you continue struggling with unused dashboards and ignored reports, or will you join the successful 13% who’ve discovered the power of data storytelling?
Ready to transform your approach to business analytics? Pivot BI Analytics specializes in helping SMEs build data storytelling capabilities that drive real business results. Our proven framework has helped dozens of companies move from analytics frustration to insight-driven success.
The methodology you’ve learned in this article represents just the beginning. True transformation requires customized implementation, stakeholder training, and ongoing refinement based on your specific business context.
Take the next step: Schedule a complimentary data storytelling audit to discover how our specialized approach can transform your business intelligence investment into a competitive advantage that drives measurable growth.
During your audit, we’ll:
- Assess your current analytics capabilities and identify gaps
- Map your stakeholder needs and communication preferences
- Develop a customized implementation roadmap
- Provide sample data story examples relevant to your industry
- Calculate potential ROI from improved analytics effectiveness
Request Your Free Data Audit →
Frequently Asked Questions
Q1: What percentage of small business data projects actually succeed? A: Only 13% of SME data projects deliver their promised business value, according to recent industry research. The main reason for failure isn’t technology—it’s the inability to transform data into actionable business narratives. This challenge is commonly discussed in business intelligence forums on LinkedIn and Reddit, where SME owners frequently share frustrations about unused dashboards and reports that don’t drive decisions. The successful minority focuses on data storytelling rather than just data visualization.
Q2: How much do failed analytics projects cost small businesses? A: Failed analytics projects cost SMEs between $15,000-$85,000 in direct costs, plus significant hidden expenses including lost productivity (15-30% decline during transition periods) and opportunity costs from delayed decision-making. Industry analysis suggests SMEs collectively waste over $2.3 billion annually on ineffective BI implementations. These figures exclude the psychological cost of team morale impact from repeated failed initiatives.
Q3: What’s the difference between data visualization and data storytelling? A: Data visualization creates charts and graphs from numbers, while data storytelling weaves those visualizations into compelling narratives that drive business action. This distinction is frequently misunderstood in startup forums on Y Combinator and Reddit, where founders often assume better charts automatically lead to better decisions—a costly misconception. Data storytelling requires context, narrative structure, and action-oriented conclusions that visualization alone cannot provide.
Q4: Can small businesses compete with enterprises using advanced tools like Tableau Next? A: SMEs don’t need enterprise-level tools to achieve analytics success. Many successful small businesses outperform large competitors using mid-market solutions combined with strong data storytelling capabilities. The key is selecting tools that match your team’s skills and business needs, not chasing the latest enterprise features. Tableau Next and similar advanced platforms often create more complexity than value for resource-constrained SMEs.
Q5: How long does it take to see ROI from data storytelling initiatives? A: Most SMEs see measurable improvements in decision-making speed and quality within 30-60 days of implementing data storytelling frameworks. Full ROI typically materializes within 6-12 months, with successful companies reporting 340% returns on their analytics investments through improved business outcomes. The key is starting with pilot projects that demonstrate quick wins before scaling to comprehensive implementation.
Q6: What are the biggest mistakes SMEs make with business analytics? A: The most common mistakes include collecting too much data without clear purpose, creating technical presentations for business audiences, failing to connect insights to specific actions, and measuring system usage rather than business impact. LinkedIn discussions and Reddit analytics communities frequently highlight these issues, with many SME owners reporting investment in expensive platforms that gather digital dust because they don’t drive decision-making.
Q7: Do I need technical skills to implement effective business analytics? A: No. The most successful SME analytics initiatives are led by business professionals who focus on storytelling and strategic insights rather than technical implementation. Non-technical founders often achieve better results because they prioritize business outcomes over technical features—a perspective frequently shared in entrepreneurship communities and business forums. The key is understanding your audience and crafting compelling narratives, not mastering complex software features.
Pivot BI Analytics LLC specializes in Data Storytelling, Customer Journey Mapping, and Business Insights Development for small and medium enterprises. Our proven methodologies transform analytics investments into competitive advantages that drive measurable business growth.
Ready to join the successful 13%? Contact us today to begin your data storytelling transformation.
📧 Email: contact@pivotbianalytics.com
🌐 Website: pivotbianalytics.com